Guide
Definition and Interpretation
The following is cited from Dr. Warren D. Smith’s paper [1].
Prediction probability \(P_k\) is a variant of Kim’s \(d_{y.x}\) measure of association [4] . Kim’s \(d_{y.x}\) is defined for ordinal variables \(x\) and \(y\) in terms of the types of pairs of data points just described. Let \(P_c\) , \(P_d\) , and \(P_{tx}\) be the respective probabilities that two data points drawn at random, independently and with replacement, from the population are a concordance, a discordance, or an \(x\)-only tie. The only other possibility is that the two data points are tied in observed depth \(y\); therefore, the sum of \(P_c\), \(P_d\), and \(P_{tx}\) is the probability that the two data points have distinct values of observed anesthetic depth, that is, that they are not tied in \(y\).
Kim’s \(d_{y.x}\) is defined to be
Alternatively, we define prediction probability \(P_k\) to be
which, by inserting (1) into (2), becomes
Thus, \(P_k\) and Kim’s \(d_{y.x}\) differ in scale and range of values but convey the same information. As desired, both Kim’s \(d_{y.x}\) and \(P_k\) reward concordances, penalize discordances and indicator-only ties, and ignore ties in observed depth \(y\). The range for Kim’s \(d_{y.x}\) is from -1 to +1, while that for \(P_k\) is from 0 to 1. When the probabilities of discordance and indicator-only tie are both zero, \(d_{y.x}\) and \(P_k\) both equal 1. When the probability of discordance equals that of concordance, \(d_{y.x} = 0\) and \(P_k= 0.5\). A negative value of \(d_{y.x}\), or a value of \(P_k\) less than 0.5, means that discordances are more likely than concordances.
The advantage of prediction probability \(P_k\) over \(d_{y.x}\) is its simple interpretation as a probability that directly relates to the goal of using indicator value to predict observed anesthetic depth. Specifically, given two randomly selected data points with distinct observed anesthetic depths, \(P_k\) is the probability that the indicator values of the data points predict correctly which of the data points is the lighter (or deeper). Appendix A supports this interpretation. A value of \(P_k= 0.5\) means that the indicator correctly predicts the anesthetic depths only 50% of the time, i.e., no better than a 50:50 chance. A value of \(P_K= 1\) means that the indicator predicts the anesthetic depths correctly 100% of the time.
Calculation procedure and derivation
Please refer Dr. Warren D. Smith’s papers for a better understanding of the calculation procedure and derivation [1, 2].
Specifically for the Chinese users, we provide an unofficial translated version of Dr. Warren D. Smith’s famous paper [1]. The translated paper could be acquired from this link. A option method is to scan the following QR code using the Baidu NetDisk Mobile App.

This is the caption of the figure
If the link above was invalid, please us contact via email. We will update the links in a furture version of the documentation!
Function explainations
calculate_pk
The following gives a detailed intro to the calculate_pk.
Input check
For input \(x\) and \(y\), the function conducts the following check before the calculation starts. If the checks fails, the code will not be carried on and the error info will be given at the same time.
Check type |
Description |
Error Info |
|---|---|---|
Data type of \(x\) |
Ensure \(x\) is a list or pandas.Series. |
x should be a list or pandas.Series. |
Data type of \(y\) |
Ensure \(y\) is a list or pandas.Series. |
y should be a list or pandas.Series. |
Data range of \(x\) |
Ensure each value in \(x\) is numeric. |
x should not contain any non-num. |
Data range of \(y\) |
Ensure each value in \(y\) is numeric. |
y should not contain any non-num. |
Data range of \(x\) |
Ensure each value in \(x\) is not a nan. |
x should not contain any nan. |
Data range of \(y\) |
Ensure each value in \(y\) is not a nan. |
y should not contain any nan. |
Data length of \(x\) and \(y\) |
Ensure \(x\) and \(y\) has the equal number of values. |
x and y should contain the same cases. |
Data length of \(x\) and \(y\) |
Ensure the number of \(x\) and \(y\) is greater than 2. |
x and y should contain at least two cases. |
Distinct values of \(y\) |
Ensure \(y\) has 2 distinct values at least. |
The distinct values of y should be at least two. |
Basic output
Take the output in the quickstart as the example, an instance output of calculate_pk contains the five elements except the basic title named “PK calculation”, if leave all the argument the defalut value.
==============
PK calculation
==============

  PK    SE0    SE1  jack_ok      PKj    SEj
-----  -----  -----  ---------  -----  -----
0.500  0.000  0.000  False        nan    nan


==============
PK calculation
==============

  PK    SE0    SE1  jack_ok      PKj    SEj
-----  -----  -----  ---------  -----  -----
0.900  0.124  0.085  True       0.901  0.117
The explain of the elements could be found in the following table.
Element name |
Value range |
Description |
|---|---|---|
PK |
[0,1] |
The PK value. |
SE0 |
[0,1] |
The adjust of the approximate standard error 1. |
SE1 |
[0,1] |
The approximate standard error 1. |
jack_ok |
True or False |
Whether this calculation could conduct the Jackknife method [5]. |
Pkj |
[0,1] or nan |
The estimated PK value using Jackknife method. If jack_ok is False, this value will be a nan. |
SEj |
[0,1] or nan |
The estimated value of approximate standard error using Jackknife method. If jack_ok is False, this value will be a nan. |
More output
Except the five basic output elements, the calculate_pk function also provide the intermediate results during the calculation. As a matter of fact, the return value of this function is a dict of Python. The intermediate results are also stored in the dict. You could visit the results you want by point a specific key of the dict. The supporting keys includes the following:
from pk4adi.pk import calculate_pk

x = [0, 0, 0, 0, 0, 0, 1, 1, 2]
y = [1, 1, 1, 1, 1, 2, 3, 3, 4]

ans = calculate_pk(x, y, auto_print = False)

print(ans.keys())

for key in ans:
  print(key, ans[key])
You will get the following output:
dict_keys(['type', 'A', 'S', 'C', 'D', 'T', 'SA', 'CA', 'DA', 'TA', 'jack_ok', 'n_case', 'n', 'Qc', 'Qd', 'Qtx', 'Qcdt', 'dyx', 'PK', 'Qcc', 'Qdd', 'Qcd', 'Term1', 'Term2', 'Term3', 'SE1', 'SE0', 'PKm', 'SPKm', 'SSPKm', 'PKj', 'SEj'])
type pk
A [[5 0 0]
[1 0 0]
[0 2 0]
[0 0 1]]
S [[5 5 5]
[1 1 1]
[0 2 2]
[0 0 1]]
......
All the names of the intermediate results is listed above. Notice the second line, the value of key type is pk, which indicates the dict is a output of calculate_pk. You could specific the intermediate result you want in this pithy way:
from pk4adi.pk import calculate_pk

x = [0, 0, 0, 0, 0, 0, 1, 1, 2]
y = [1, 1, 1, 1, 1, 2, 3, 3, 4]

ans = calculate_pk(x, y, auto_print = False)

print(ans['PK'])
You will get the following output:
0.9
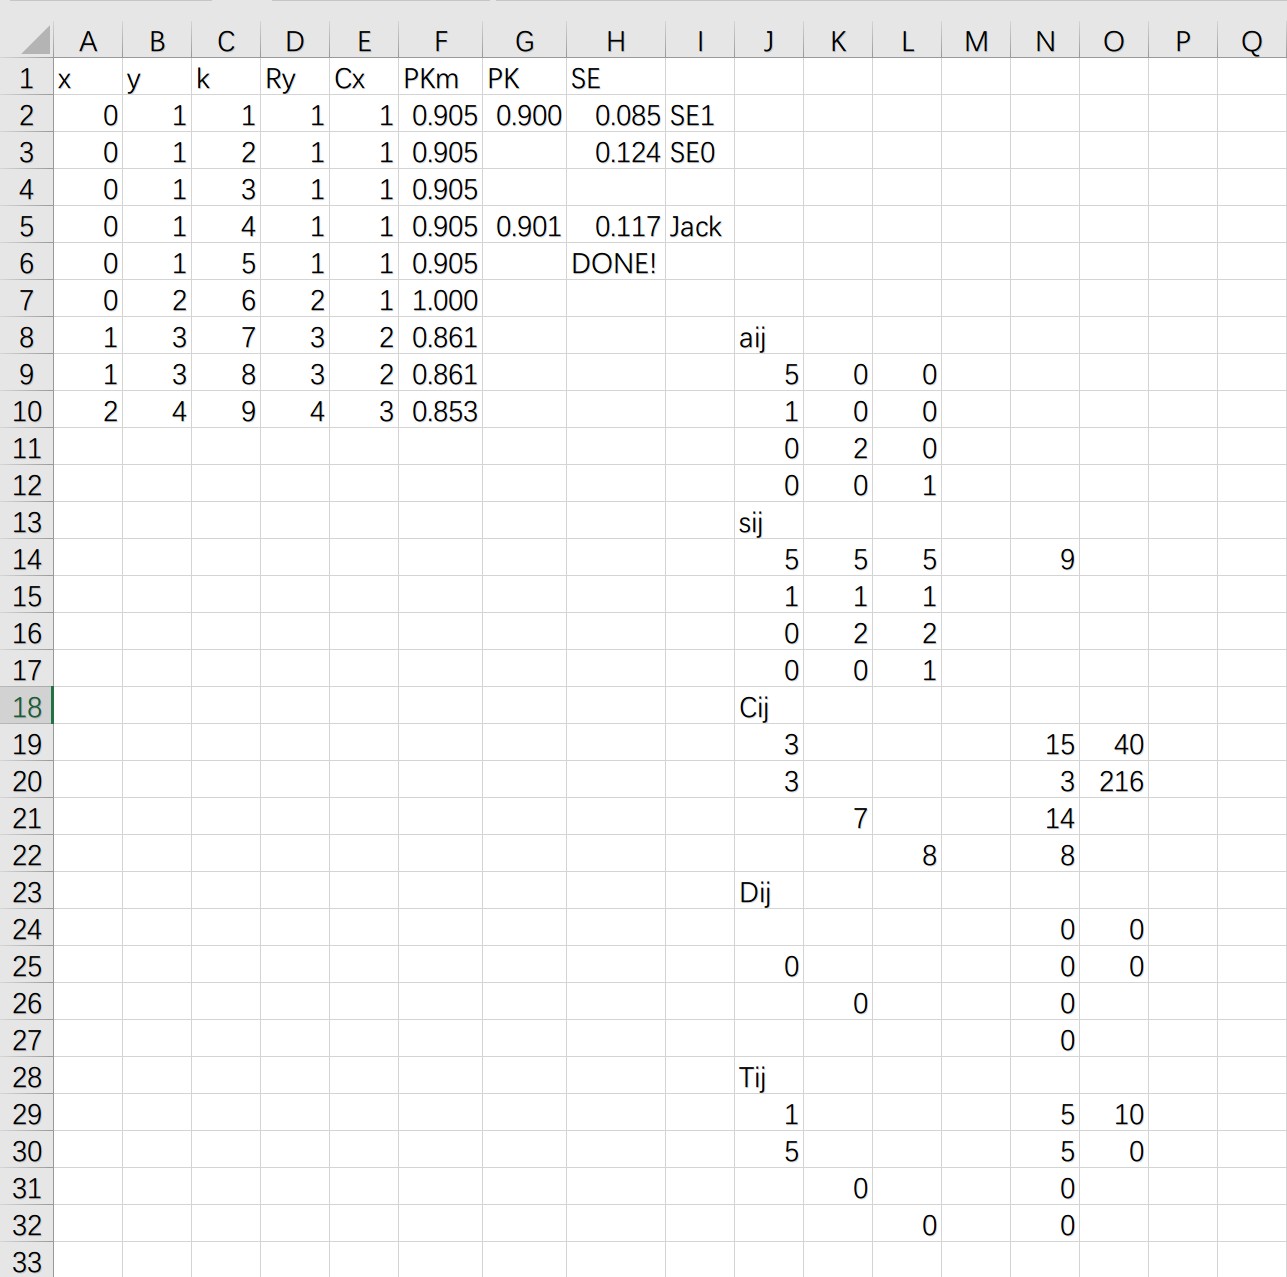
Contrast with the result using PKMACRO.xls
The following demonstrates the result using PKMACRO.xls for the two instances in quickstart.

This is the caption of the figure
This is the caption of the figure
compare_pks
The following gives a detailed intro to the compare_pks.
Input check
Check type |
Description |
Error Info |
|---|---|---|
Data type of \(pk1\) |
Ensure \(pk1\) is a valid return value of calculate_pk(). |
pk1 must be the output of the function calculate_pk(). |
Data type of \(pk2\) |
Ensure \(pk2\) is a valid return value of calculate_pk(). |
pk2 must be the output of the function calculate_pk(). |
Data length of \(pk1\) and \(pk2\) |
Ensure the n_case of \(pk1\) and \(pk2\) has the equal number of values. |
The n_case of pk1 and pk2 must be the same. |
Data length of \(pk1\) and \(pk2\) |
Ensure the n_case of \(pk1\) and \(pk2\) is greater than 1. |
The n_case of pk1 and pk2 must be greater than 1. |
Basic output
==============
PKs comparison
==============

=================
For Group (z-test)
=================

  PKD    SED     ZD    P value  Comment
-----  -----  -----  ---------  ---------
0.068  0.101  0.669      0.504  P > 0.05


=================
For Pair (t-test)
=================

  PKDJ    SEDJ    DF     TD    P value  Comment
------  ------  ----  -----  ---------  ---------
0.030   0.066    23  0.453      0.327  P > 0.05